Monday, June 15, 2020

Arsenal at Manchester City Preview

Is it just me or is it extremely weird to have Arsenal playing just a couple days from now?

I guess in the sense that typically after the summer off-season, there is a certain cadence to how things go and that leads to a huge build up to the first match of the season. This over 100 day break is unprecedented in the middle of the season and soccer has easily been among the least important things.

I suppose that some of the regular things that happen in the summer are starting to get going. There is a major transfer rumor about Thomas Partey (which is quite controversial right now and because I am a content producer I should weigh in on that) and then there is the contract sagas for Pierre-Emerick Aubameyang and Bukayo Saka starting to move in to concerning areas.

The last thing that is nagging me is how in the hell do you account for a three month break when you write about things from a stats perspective? My best guess is that you have to be even less certain about things than you would (or should) have been before the break.

Enough preamble I guess let's get into the Arsenal at Manchester City Preview.


This shouldn't be surprising but Manchester City are a better team than Arsenal and even though they won't be winning the Premier League are easily one of (if not) the best team in Europe.

I don't expect that this will be a particularly even battle between the two teams but it will be a very interesting test of how Mikel Arteta sees his team and how they should take on matches like this. It will be interesting where on the two kind of extremes he chooses to go towards with the Arsene Wenger style of playing to his team's strength vs the Unai Emery style of looking to neutralize the opponents strength.

I think that because of where this falls on the schedule of things that we might see a higher return to playing more towards the Emery style with more time to train for a specific opponent in mind compared to the weekly league grind where there just isn't that much time to put in specific game plans.

Wednesday, March 20, 2019

Top 5 xG Chances

This post was adapted from a post originally published on The Short Fuse:
 

I have been creating these videos on the top 5 chances and 5 least likely goals for a couple weeks and I have really liked how they have turned out.

If you don't feel like looking at me (honestly there isn't that much of me in the video) you can read below on the top 5 chances.

5. Terence Kongolo, Philip Billing and Jason Puncheon

Ok so I’m already breaking my own arbitrary rules here and giving three shots for the 5th spot. The reason that I am doing this is to not only point out that Kongolo’s shot was one of the 5 highest but to also help answer the question of how multiple shots that are all part of one sequence are handled.


This shot was saved and fell to Philip Billing:


This shot was not hit clean and then fell to Jason Puncheon:


Overall, that is 3 shots, with a total xG of 1.43. Yes I know 1.43 is larger than 1, which represents 1 goal, so how is that possible and why didn’t a goal get scored.

Well I am glad you asked. The way that I handle situations like this is by using conditional probability for shots that are part of the same sequence. For this, a new sequence starts when the ball goes out of play, the defensive team takes possession of the ball and completes 3+ offensive actions, or more than 15 seconds elapse between shots (this is a made up cutoff but I feel like after more than 15 seconds a defense should be able to regroup and become set again).

For these 3 shots, they are all part of the same attacking sequence and the xG for the full sequence breaks down like this:


The first shot is treated normally, the second shot depends on the probability of the first shot not being converted into a goal (0.508) and that is multiplied by the xG of that shot and gets you 0.232. The third shot is dependent on both the first and second shots not being goals and that has a probability of 0.276, so you then multiple that by the xG of 0.48 to get an xG for that shot of 0.133. Overall there is an xG of 0.857 for the sequence of 3 shots.

 4. Gonzalo Higuaín


This chance was created by Jorginho playing a gorgeous first time through ball over the top of the Everton defense. Don’t believe the haters who say he only passes sideways Jorginho is bad and Chelsea should look to get rid of him this summer, he doesn’t provide anything for their team besides sterile possession.

Thankfully for Arsenal’s top 4 odds Higuaín didn’t finish this shot and Chelsea went on to lose.

3. Mohamed Salah


This was a great two man counter attack chance by Liverpool. It started with Salah coming back to pressure the ball. Sadio Mané getting to the ball first and then both running like crazy to attack. One of the more interesting parts of this chance was the run taken by Salah that really seemed to confuse Fulham.


Instead of running down the right channel, Salah runs behind Mané and that leaves Arsenal loanee Calum Chambers in the nearly impossible position of having to defend both players. In the end Salah’s shot is saved but it doesn’t change the result for either team.

 2. Sadio Mané


This shot is the result of a one-two with Roberto Firmino. It ends with the ball cut back to Mané to slot home. It is something that Unai Emery would love.

 1. Ryan Babel


This is a situation where xG really underrates the quality of the chance due to a lack of information in the event data.

In the lead up to this shot, James Milner slices a clearance, Virgil van Dijk under hits his back pass header and then Babel wins a 50/50 with a fortunate bounce that leads him all alone with an empty net to shoot at.

It is still rated highly but this should be as close to 1 as xG comes.

Friday, November 16, 2018

Introducing Pass Zone Rating

During the international break times I like to take some time away from the daily grind of creating content and work on more research focused work. During this international break I wanted to take some time to work on using the pitch zones that I have in my database.

When I created the pitch zones, I had five zones across the width of the pitch and ten across the length.


One of the things that I always found interesting with these zones is looking at the different passing statistics for each zone.

So I thought it would be interesting to take the zones and use that as the basis for a way to measure passing skills. The idea for this is sort of similar to the defensive statistic Ultimate Zone Rating (UZR) from baseball.

To do this I went to my Premier League stats database that has data for the current season going back to 2015-16. There are a total of 1,333,739 passes that this is based on. I then took each zone and looked at the pass completion percentage based on which third it ended up in (Defensive third, Mid third or Final third), the length of the pass (less than 15 yards short, greater than 35 long, anything else medium) and finally the direction of the pass (forward, backward or square).

As my database expands even further it would be nice to be able to get even more granular with the different buckets but I think right now this works well. There is an average of 1,863 passes in each bucket and a median of 942 passes which I think makes things for a fairly robust sample for most buckets. For the zones with less than 100 passes, I used the average completions for the neighboring zones to make things more robust.

After setting the baseline for the completion percentages for each zone for each type of pass I then took that and called it "Expected Pass%" and compared that the outcome of each pass. Pass Zone Rating equals pass outcome (0 or 1) minus the expected pass completion. A completed pass will have a positive value and a missed pass will have a negative value.

Here is the top 15 in the Pass Zone Rating for this season:
The next thing that I did was look at the Pass Zone Rating and used Passing Value Added to take the expected vs actual passing and the value each pass was worth. For this, I took the passing value added and multiplied by the Pass Zone Rating and I called this Pass Zone Rating Plus.

Here is the top 15 this season in this stat:
What stands out is that there are some players that don't rate well on Pass Zone Rating but do well in this statistic. I think that is because while they don't complete a lot of passes, they do complete high value passes at a high rate.

You'll also notice on the far right there is a PZR per 1,000, I created that to normalize everyone to 1,000 passes so that people with more passes don't emerge as the leaders from accumulating a lot of easy passes.

This is a work in progress still but it is available for the 2018-19 season to Patreon Subscribers.

Thursday, November 16, 2017

Thinking about a Passing Ability Stat

I am very happy with my passing value added stat, I think it adds more to the measuring of attacking passing but I think that it is missing something as overall passing statistic.

So today while I was procrastinating writing a stats preview for the North London Derby (Look for it tonight/tomorrow, it's got some good stuff in there!) I was thinking about passing.

One of the thoughts that popped into my head was looking at the completion percentage above average based on the three thirds of the pitch and also long passing (maybe short passing? I didn't include this but maybe I should, that is why I am writing this out).

The simplest way to do this is:

player pass completion for third / league average pass completion for third * 100

Take Mesut Ozil for Final 3rd Passing:

0.727 (his completion%) / 0.614 (Lg Avg) *100 and you get 118 which also helpfully easily translates to 18% better than league average

For this stat I did that for Defensive 3rd passing, Middle 3rd Passing, Final 3rd passing and Long Ball passing.

To combine them into one stat the are all weighted by the total number of attempts in each category for an overall number. This creates the stat that for the time being I am labeling Pass+

As a quick aside the reason I am doing these where it is because it is compared to average and setting everything to 100 is because, well I come from a baseball background where this is common and I believe that it is easier to grasp that numbers over 100 are good, 100 is average and below is bad. It also has the added benefit of each number above or below can be pretty easily described as that many percent above or below average.

The next thing that I did with this stat is bring in my passing value added stat. The reason for this is that I think a passing stat shouldn't just measure completing passes but also should also include attacking value which I think PPVA does well at.

So similar to the other stats I got this on the same scale, but for this I made an adjustment to use the 75th percentile value instead of the average because otherwise things got really screwy. Maybe someone smarter than me can give pointers on a better way to work this out but this is what I did to make the scale work out better with the other stats.

So once I had PPVA+ I combined them into one stat that for the time I am calling Passing Ability. I don't love this name and would like to think of something else. The method for combing them was that the Pass+ stats are weighted 4 times the value of PPVA+ (I did this because it is made up of 4 stats and it seemed about right, again all a work in progress).
And the tableau for the premier league to play with:

Thursday, October 12, 2017

Creating Radar Charts in Tableau - A How To

During the international breaks I like to try creating something new, it is nice to get away from the day to day of the club schedule and play around with data.

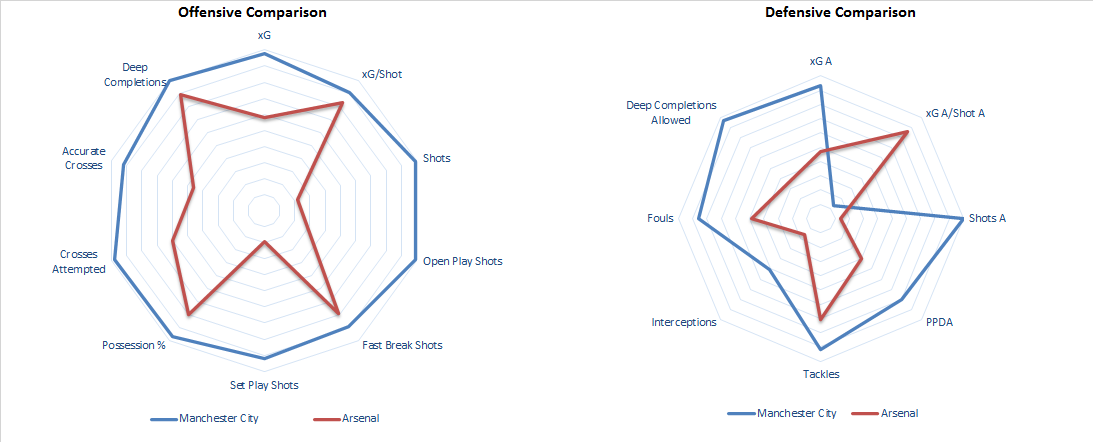
During this international break I have worked on figuring out a way to replicate Ted Knutson's very popular Radar charts.

My knock off seems to be fairly popular as well so I wanted to give a bit of a rundown on how to create them should you ever want to try it yourself.

This is based on this template that was posted on the tableau blog.

The first step is getting your data ready. For this walk through I am using the creation of my midfield template.

To have the data play nicely with the radar it all must be normalized to the same scale. To do this I will make everything run between 0 and 100. So I identify each set of data and the minimum and maximum value to be used to calculate the value for the radar.

Stat Name M Min Max
Pass% Value M 74 90
Key Passes Value M 0.7 2.5
PPVA Value 0.03 0.55
xG Buildup Value 0.1 0.6
xG+xA Value 0.1 0.5
Drib Value M 0.5 2.1
Disp Value M 2.4 0.5
Fouls Value 2.4 0.6
DribPast% Value 60 20
Suc Tackles Value 1 3
Int Value 1 3
Suc Long Balls Value 0.53

Narrowing the list down to 12 values (I even through on one more than Ted!) is very tough but I feel that this gives a good overview of the different things you want to measure from a midfielder. It has passing, chance creation, overall scoring contribution, dribbles and ball retention, and some defense. It isn't perfect because nothing is and when you make your own you can go crazy with what ever you want to include. The minimum and maximum are at the 95th percentile and the 5th percentile of the stat.


Above is an example of normalizing Passing% to 100. First I have an If statement for values greater than 0.9, then values for below 0.74 and then finally for values in between. To do this you subtract the minimum value and then divide by the spread between minimum and maximum and multiply by 100. 

When done it should look something like this:

So you go through and do this for all of the stats you want to include in the radar. Once you are complete with that go to Analysis -> View Data and select all of the data to copy into an excel sheet.


In the excel sheet you will add a column for the order that you want the stat to show up on the radar.  For this each stat will have this order:

Stat Name M Order
Pass% Value M 1
Key Passes Value M 2
PPVA Value 3
xG Buildup Value 4
xG+xA Value 5
Drib Value M 6
Disp Value M 7
Fouls Value 8
DribPast% Value 9
Suc Tackles Value 10
Int Value 11
Suc Long Balls Value 12
The next step is to create the radar in tableau. So create the new worksheet and add the newly created excel data to the data connection. 

Next is to create the x Value we will use. We will create a calculated field, I am naming mine X-M and enter the values for the X coordinates for each stat: 

CASE [Stat Name M]
WHEN "Pass% Value M" THEN 0
WHEN "Key Passes Value M" THEN [Per90 Stat Value] *(1/2)
WHEN "PPVA Value" THEN [Per90 Stat Value] *(sqrt(3)/2)
WHEN "xG Buildup Value" THEN [Per90 Stat Value]
WHEN "xG+xA Value" THEN [Per90 Stat Value] *(sqrt(3)/2)
WHEN "Drib Value M" THEN [Per90 Stat Value] *(1/2)
WHEN "Disp Value M" THEN 0
WHEN "Fouls Value" THEN [Per90 Stat Value] *(-1/2)
WHEN "DribPast% Value" THEN [Per90 Stat Value] *(-sqrt(3)/2)
WHEN "Tackles Value" THEN [Per90 Stat Value] *-1
WHEN "Int Value" THEN [Per90 Stat Value] *(-sqrt(3)/2)
WHEN "Suc Long Balls Value" THEN [Per90 Stat Value] *(-1/2)
END


And then the same with the Y Values:

CASE [Stat Name M]
WHEN "Pass% Value M" THEN [Per90 Stat Value]
WHEN "Key Passes Value M" THEN [Per90 Stat Value] *(sqrt(3)/2)
WHEN "PPVA Value" THEN [Per90 Stat Value] *(1/2)
WHEN "xG Buildup Value" THEN 0
WHEN "xG+xA Value" THEN [Per90 Stat Value] *(-1/2)
WHEN "Drib Value M" THEN [Per90 Stat Value] *(-sqrt(3)/2)
WHEN "Disp Value M" THEN [Per90 Stat Value] *(-1)
WHEN "Fouls Value" THEN [Per90 Stat Value] *(-sqrt(3)/2)
WHEN "DribPast% Value" THEN [Per90 Stat Value] *(-1/2)
WHEN "Tackles Value" THEN 0
WHEN "Int Value" THEN [Per90 Stat Value] *(1/2)
WHEN "Suc Long Balls Value" THEN [Per90 Stat Value] *(sqrt(3)/2)
END
Next you will add the X-M to the columns aggregated as an average and Y-M to the rows also aggregated as an average.

Next is to drag Stat Name M Dimension to the marks section.

Then you will convert the mark type from Automatic to Polygon.

Then drag the Order Measure to the path section in mark to fix the weird shapes.


Now we have something that looks like a Radar! However right now it is showing all of the values and we need to fix it to show only one player at a time. To do this drag the Players Dimension to the filters section. I then add it to the window as well and change it to select only single values and I also customize the filter to not show the all value.

It should look something like this now:


We are very close now. Now we will add the background image for the radar. For this I took the blank template from here and then added the values around the circle for the stats. It looks like this:
Next it will be added into Tableau. To do this you go to Map -> Background Images -> and then select your data sheet. Then you select where you saved the image and put in the matching coordinates. 

Now we should have a real radar with some minor formatting stuff to make it look pretty to finish!

The formatting that I like to do is to change the color opacity to 65% to be able to see the numbers on the image behind, have each team be assigned a color, remove the axis labels and the center lines. I then put them all in a dashboard with the Per 90 Stats and Minutes information to complete everything. The final product should look like this:


You can find the dashboard and play around with it here

Friday, September 8, 2017

Introducing Passing Progression Value Added

For a while I have been wanting to create a way to measure passing value added.

I have added a stat that is called xG chain and xG build up that was created by Ted Knutson and Thom Lawrence for Statsbomb services. Mine might be a bit different but I have tried to follow the same general guidelines laid out in their introductory post on Statsbomb Services.

This is cool and helpful but it misses a lot of passes that don't lead to shots so I wanted to see about figuring out a way to include those. I really liked the way that Nils Mackay went about analyzing the problem and decided to use that as the starting point for my model. Mackay has gone even further in refining his model but for now I focused on making this simple for my first attempt.

What I am setting out to measure is the value added (xG in this case) between the starting point of a pass and where the pass ends.

The sporting logic behind this is that to be able to win you must score goals. Your team is better able to score goals the closer they are able to take shots to the opponents goal. Getting closer to the opponents goal through passing increases the likely hood of taking high quality shots. This last part is what I am looking to attempt to measure.

To accomplish this I use a very simple xG model to assign a value for every position on the pitch.

The equation for the xG model is this:

(1-(1/(1+((e^(-1.56335793278499+(Distance from Center*0.0000564550258161941)+ (Square Root (Distance from Endline^2+Distance from Center^2))*-0.0693321731182481)))))))

Essentialy it looks at how far you are from the center of the pitch (Closer to the Center is better) and how far you are from the center of the goal (Closer to the Center is better).

Here is what the values for areas of the field look like up and down the pitch:
To determine the value added for a successful pass this model takes the value of the ending point for the pass and then subtracts the value for the starting point for the pass.

So for example a completed pass starts at the point (60,10) and ends at the point (40,0). The end value is 0.01591 minus starting value of 0.00608 would give a simple value added of this pass of 0.00983. I have also made the decision to give a completed pass a bonus of 0.003 (the reasoning is that keeping possession to be able to continue to attack is valuable and this seems like a reasonable amount to assign, I am open to changing this) and if it starts and stays within the attacking final third an additional 0.015 is added (same reasoning as above but the attacking final third is even more important). So the total value added with this pass is 0.01283.

For an incomplete pass a player is penalized for the value to the opponent taking over at the end point of the pass. This is what the value of the pitch look like:
The values are pretty similar to above but they include the following penalties in addition to the value of where the opponents takes over: -0.01 for losing possession (the reasoning is that your team cannot attack any longer once they do not have the ball, this seems like a value that is about right but I would be open to changing) and if the pass is lost in the defensive third an additional 0.015 is subtracted.

An example again, lets say that again we try to pass from the point (60,10) and ends at the point (40,0) but is intercepted. The value for this pass would be -0.01327, -0.00327 for the opponent taking over and -0.01 for losing possession.

These calculations are done for every pass attempt in the game.

I have gone back and done this for all of the games in the 2017-18 season thus far and added this stat to the Tableau database under the passing tab.

Also here are the top 25 in raw Value Added from the Premier League through the first 3 weeks:

Thursday, September 7, 2017

Premier League Week 4 Projections

After a long international break it is time to get back to club football. As an Arsenal fan and American it has been a pretty crappy couple of weeks with the results but according to the odds it looks like things should hopefully get better.

Without any further rambling here are the odds for week 4 of the Premier League:
After several weeks with lots of heavy favorites, this week only Arsenal breaks the 50% odds barrier, As a pessimist this also likely means that of the big teams Arsenal will have their result go against them.

The Manchester City vs Liverpool match up looks really good and even with a 4:30 am kick off I will probably still do my best to wake up to watch it. I have City as the favorite but with Liverpool's track record and how they just dominated Arsenal it could definitely be closer than the odds suggest.

A new thing that I tweeted out this week is the relative strength rankings for each team that feeds into these projections.
This week we have a 1 vs 3 match up and a 4 vs 7 match up which might end up as one of the better weekends for top teams going against each other.

On the title projection front, things have narrowed down to a few favorites with the rest of the big teams falling back:

Click to Enlarge
Manchester City is still the title favorite but Manchester United and Liverpool have both moved to over 20% for the title odds.* Arsenal's season might be collapsing but I still have them as the 4th highest title odds so maybe things aren't as bad as it seems after two losses.

Another new thing I tweeted out today was the team performance compared to the expected points based on odds and based on expected goals:
This is pretty interesting, I wouldn't expect Huddersfield to keep up this performance but the points that they have already banked are very valuable and can't be take away. Also even with the only perfect record, Manchester United haven't over performed by a crazy amount, Jose might be doing his second year magic.
-
This article was written with the aid of StrataData, which is the property of Stratagem Technologies. StrataData powers the StrataBet Sports Trading Platform, in addition to StrataBet Premium Recommendations.

*Note: If teams tie on points this assigns both to that position, I have not added a goal differential to break ties. Here is a further explanation for how these projections work.